


Data visualization and data analytics are two closely related fields that are essential for businesses of all sizes. Data visualization is the process of transforming data into visual representations, such as charts, graphs, and maps. Data analytics is the process of collecting, cleaning, and analyzing data to extract insights and make informed decisions.
Both data visualization and data analytics are important tools for businesses, but they serve different purposes. Data visualization is used to communicate data in a way that is easy to understand and interpret. Data analytics is used to find patterns and trends in data, and to identify opportunities for improvement.
In this article, we will discuss the key differences between data visualization and data analytics, and we will explore how each can be used to improve business performance.
What is Data Visualization?
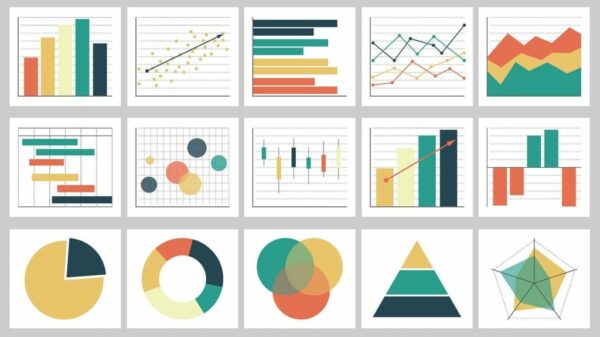
Data visualization is the process of transforming data into visual representations, such as charts, graphs, and maps. The goal of data visualization is to communicate data in a way that is easy to understand and interpret.
Data visualization can be used to:
- Communicate complex data in a way that is easy to understand
- Identify patterns and trends in data
- Compare different data sets
- Make data-driven decisions
What is Data Analytics?
Data analytics is the process of collecting, cleaning, and analyzing data to extract insights and make informed decisions. Data analytics can be used to:
- Identify patterns and trends in data
- Predict future behavior
- Make data-driven decisions
Data Visualization vs. Data Analytics
Data visualization and data analytics are two closely related fields, but they serve different purposes. Data visualization is used to communicate data in a way that is easy to understand and interpret. Data analytics is used to find patterns and trends in data and to identify opportunities for improvement.
The following table summarizes the key differences between data visualization and data analytics:
| Feature | Data Visualization | Data Analytics |
|---|---|---|
| Purpose | Communicate data | Find patterns and trends, identify opportunities for improvement |
| Tools | Charts, graphs, maps | Statistical software, machine learning algorithms |
| Skills | Graphic design, visual communication | Statistics, programming, data analysis |
drive_spreadsheetExport to Sheets
Which Should You Choose?
The best choice for you will depend on your specific needs and goals. If you need to communicate complex data in a way that is easy to understand, then data visualization is a good option. If you need to find patterns and trends in data, or to identify opportunities for improvement, then data analytics is a good option.
In many cases, it is beneficial to use both data visualization and data analytics together. Data visualization can be used to communicate the results of data analytics to a wider audience. Data analytics can be used to inform the design of data visualizations.
Conclusion
Data visualization and data analytics are two important tools for businesses of all sizes. By understanding the key differences between the two, you can choose the right tool for your specific needs.
Here are some additional tips for choosing between data visualization and data analytics:
- Consider the size and complexity of your data set. If you have a large or complex data set, then data analytics may be a better option.
- Consider the audience for your results. If you need to communicate your results to a non-technical audience, then data visualization may be a better option.
- Consider your budget. Data analytics can be more expensive than data visualization.
If you are still unsure which tool is right for you, then you can consult with a data scientist or data analyst. They can help you assess your needs and recommend the right tool for your situation.